Examples for comprehensive GC/LC-MS data evaluation Classification of GC-MS data In complex samples up to 200..500 compounds can be detected.
Therefore a classification is essential. In some cases a classification via retention time or peak height may be adequate. There are lot of examples with classification of GC data with different multivariate methods. An online example is the Chemometric Analysis of Gas Chromatographic Data of Oils from Eucalyptus species. You will find other examples and reviews in the literature section. But for a
finer analysis you can do a classification of the raw mass spectra (also including retention times). These raw samples can be classified using supervised and unsupervised methods like: partial least squares - PLS artificial neural networks - ANN self-organizing maps - SOM (an ANN method) linear discriminant analysis - LDA
k-nearest neighbours - k-NN soft independent modeling of class analogy - SIMCA principle component analysis - PCA canonical analysis cluster analysis
As a first step you can use the spectral similarity information from AMDIS post processing. This is based on a normalized dot product of the spectra being compared (S.E. Stein, D.R.Scott).
If you want to classify your own spectra you need: AMDIS and the included AMDIS LIBRARY EDITOR - [LINK]
Choose the example file 50p0830d start in low/low/low mode. Export the the peaks via the menu Library/Build one Library/Files/Create New Library/New target library/50P0830D.msl
Now you can add All components or selected targets. It is important that you select save as target library as
this selection allows the creation of a new file with all peaks. In the second step you have to save the *.msl file as *.msp file (simple MS file *.MSP) via the Save Library as button. You now have a file with raw mass spectra.
LIB2NIST - [ LINK] Load the MSP file and convert it to a HP JCAMP file. (External link from NIST)
JCAMP4PCA - as text [ LINK] and the newest version V0.92 as zip file [ ZIP] Run EXCEL and start the Visual Basic Editor via Extras/Macros/Visual Basic Editor.
Now import the jcamp4pca.bas via File/Import File *.bas After loading you should start the module via run
module after choosing the file in the project window. In the following file dialog box choose 50P0830D.HPJ and convert it. After 5 seconds you now have a nice export version of all peaks. Each column is one cleaned AMDIS peak.
Programs for classification - [ LINK] Now you can import all cleaned peaks to your preferred classification program. For confirming the peaks sort the
peaks in the AMDIS library editor via Source: Sort by ID
In the following graphic you can see a simple unsupervised classification of raw mass spectra from a complex GC-MS sample using Principal Component Analysis (PCA) and clustering via k-means algorithm. Please note that the clusters may have similar mass spectra and most of these compounds will be related structurally, but this is no must. You should confirm or verify your results. 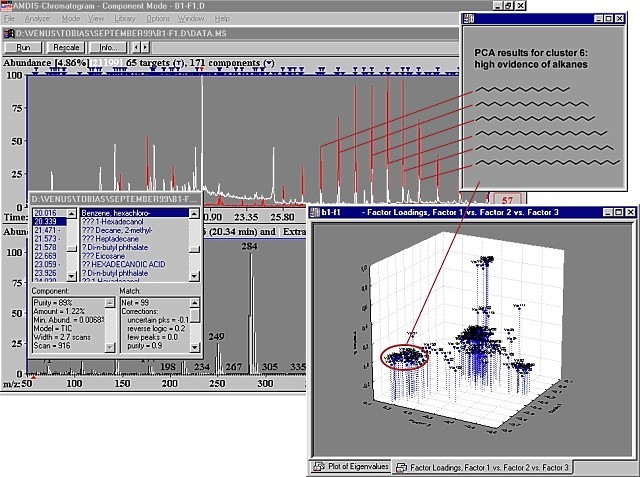
|